網站首頁 編程語言 正文
Linux/Ubuntu/Arm設備中通過/proc/stat等文件計算Cpu使用率
- 一、proc文件系統
- 1. /proc/cpuinfo文件
- 2. /proc/stat文件
- 3. /proc/<pid>/stat文件
- 4. /proc/<pid>/task/<tid>/stat文件
- 二、系統中有關進程cpu使用率的常用命令
- 1. ps 命令
- 2. top命令
- 三、單核情況下Cpu使用率的計算
- 1. 基本思想
- 2. 總的Cpu使用率計算方法
- 3. 某一進程Cpu使用率的計算方法
- 4. 某一線程Cpu使用率的計算方法
- 四、多核情況下cpu使用率的計算
- 1. 實驗一
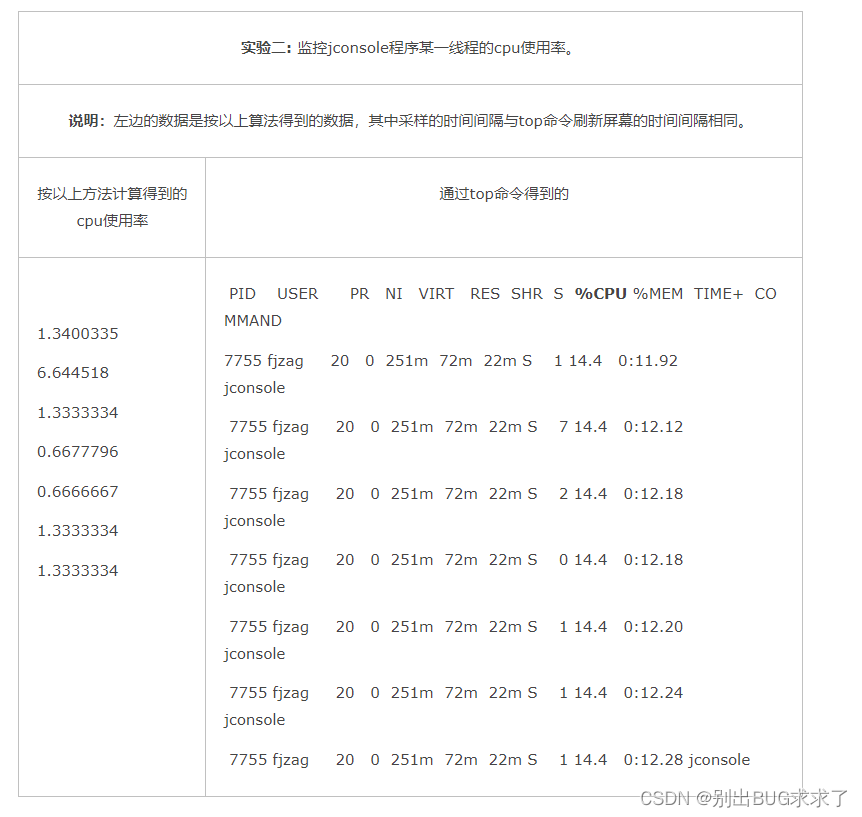
- 2. 實驗二
- 五、主要問題:
一、proc文件系統
/proc文件系統是一個偽文件系統,它只存在內存當中,而不占用外存空間。它以文件系統的方式為內核與進程提供通信的接口。用戶和應用程序可以通過/proc得到系統的信息,并可以改變內核的某些參數。由于系統的信息,如進程,是動態改變的,所以用戶或應用程序讀取/proc目錄中的文件時,proc文件系統是動態從系統內核讀出所需信息并提交的。
/proc目錄中有一些以數字命名的目錄,它們是進程目錄。系統中當前運行的每一個進程在/proc下都對應一個以進程號為目錄名的目錄/proc/pid,它們是讀取進程信息的接口。此外,在Linux 2.6.0-test6以上的版本中/proc/pid目錄中有一個task目錄,/proc/pid/task目錄中也有一些以該進程所擁有的線程的線程號命名的目錄/proc/pid/task/tid,它們是讀取線程信息的接口。
1. /proc/cpuinfo文件
該文件中存放了有關 cpu的相關信息(型號,緩存大小等)。
[zhengangen@buick ~]$ cat /proc/cpuinfo

processor       : 0

vendor_id       : GenuineIntel

cpu family      : 15

model           : 4

model name      : Intel(R) Xeon(TM) CPU 3.00GHz

stepping        : 10

cpu MHz         : 3001.177

cache size      : 2048 KB

physical id     : 0

siblings        : 2

core id         : 0

cpu cores       : 1

fdiv_bug        : no

hlt_bug         : no

f00f_bug        : no

coma_bug        : no

fpu             : yes

fpu_exception   : yes

cpuid level     : 5

wp              : yes

flags           : fpu vme de pse tsc msr pae mce cx8 apic mtrr pge mca cmov pat pse36 clflush dts acpi mmx fxsr sse sse2 ss ht tm pbe lm pni monitor ds_cpl cid xtpr

bogomips        : 6004.52
說明: 以下只解釋對我們計算Cpu使用率有用的相關參數。
         參數                            解釋

processor (0)                       cpu的一個物理標識
結論1: 可以通過該文件根據processor出現的次數統計cpu的邏輯個數(包括多核、超線程)。
2. /proc/stat文件
該文件包含了所有CPU活動的信息,該文件中的所有值都是從系統啟動開始累計到當前時刻。不同內核版本中該文件的格式可能不大一致,以下通過實例來說明數據該文件中各字段的含義。
fjzag@fjzag-desktop:~$ cat /proc/stat

cpu  38082 627 27594 893908 12256 581 895 0 0

cpu0 22880 472 16855 430287 10617 576 661 0 0

cpu1 15202 154 10739 463620 1639 4 234 0 0

intr 120053 222 2686 0 1 1 0 5 0 3 0 0 0 47302 0 0 34194 29775 0 5019 845 0 0 0 0 0 0 0 0 0 0 0 0 0 0 0 0 0 0 0 0 0 0 0 0 0 0 0 0 0 0 0 0 0 0 0 0 0 0 0 0 0 0 0 0 0 0 0 0 0 0 0 0 0 0 0 0 0 0 0 0 0 0 0 0 0 0 0 0 0 0 0 0 0 0 0 0 0 0 0 0 0 0 0 0 0 0 0 0 0 0 0 0 0 0 0 0 0 0 0 0 0 0 0 0 0 0 0 0 0 0 0 0 0 0 0 0 0 0 0 0 0 0 0 0 0 0 0 0 0 0 0 0 0 0 0 0 0 0 0 0 0 0 0 0 0 0 0 0 0 0 0 0 0 0 0 0 0 0 0 0 0 0 0 0 0 0 0 0 0 0 0 0 0 0 0 0 0 0 0 0 0 0 0 0 0 0 0 0 0 0 0 0 0 0 0 0 0 0 0 0 0 0 0 0

ctxt 1434984

btime 1252028243

processes 8113

procs_running 1

procs_blocked 0
第一行的數值表示的是CPU總的使用情況,所以我們只要用第一行的數字計算就可以了。下表解析第一行各數值的含義:
參數          解析(單位:jiffies)

(jiffies是內核中的一個全局變量,用來記錄自系統啟動一來產生的節拍數,在linux中,一個節拍大致可理解為操作系統進程調度的最小時間片,不同linux內核可能值有不同,通常在1ms到10ms之間)

user (38082)    從系統啟動開始累計到當前時刻,處于用戶態的運行時間,不包含 nice值為負進程。

nice (627)      從系統啟動開始累計到當前時刻,nice值為負的進程所占用的CPU時間

system (27594)  從系統啟動開始累計到當前時刻,處于核心態的運行時間

idle (893908)   從系統啟動開始累計到當前時刻,除IO等待時間以外的其它等待時間iowait (12256) 從系統啟動開始累計到當前時刻,IO等待時間(since 2.5.41)

irq (581)           從系統啟動開始累計到當前時刻,硬中斷時間(since 2.6.0-test4)

softirq (895)      從系統啟動開始累計到當前時刻,軟中斷時間(since 2.6.0-test4)

stealstolen(0)                   which is the time spent in other operating systems when running in a virtualized environment(since 2.6.11)

guest(0)                               which is the time spent running a virtual  CPU  for  guest operating systems under the control of the Linux kernel(since 2.6.24)
結論2: 總的cpu時間totalCpuTime = user + nice + system + idle + iowait + irq + softirq + stealstolen + guest
3. /proc//stat文件
該文件包含了某一進程所有的活動的信息,該文件中的所有值都是從系統啟動開始累計到當前時刻。以下通過實例數據來說明該文件中各字段的含義。
[zhengangen@buick ~]# cat /proc/6873/stat

6873 (a.out) R 6723 6873 6723 34819 6873 8388608 77 0 0 0 41958 31 0 0 25 0 3 0 5882654 1409024 56 4294967295 134512640 134513720 3215579040 0 2097798 0 0 0 0 0 0 0 17 0 0 0
說明: 以下只解釋對我們計算Cpu使用率有用相關參數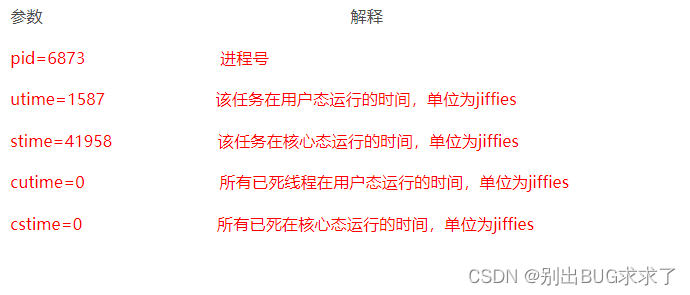
結論3: 進程的總Cpu時間processCpuTime = utime + stime + cutime + cstime,該值包括其所有線程的cpu時間。
4. /proc//task//stat文件
該文件包含了某一進程所有的活動的信息,該文件中的所有值都是從系統啟動開始累計到當前時刻。該文件的內容格式以及各字段的含義同/proc//stat文件。
注意,該文件中的tid字段表示的不再是進程號,而是linux中的輕量級進程(lwp),即我們通常所說的線程。
結論4: 線程Cpu時間threadCpuTime = utime + stime
二、系統中有關進程cpu使用率的常用命令
1. ps 命令
通過ps命令可以查看系統中相關進程的Cpu使用率的信息。以下在linux man文檔中對ps命令輸出中有關cpu使用率的解釋:
CPU usage is currently expressed as the percentage of time spent
running during the entire lifetime of a process. This is not ideal,
and it does not conform to the standards that ps otherwise conforms
to. CPU usage is unlikely to add up to exactly 100%.
%cpu cpu utilization of the process in “##.#” format. It is the CPU
time used divided by the time the process has been running
(cputime/realtime ratio), expressed as a percentage. It will not add
up to 100% unless you are lucky.
結論5: ps命令算出來的cpu使用率相對于進程啟動時的平均值,隨著進程運行時間的增大,該值會趨向于平緩。
2. top命令
通過top命令可以查看系統中相關進程的實時信息(cpu使用率等)。以下是man文檔中對top命令輸出中有關進程cpu使用率的解釋。
#C – Last used CPU (SMP) A number representing the last used processor. In a true SMP environment this will
likely change frequently since the kernel intentionally uses weak
affinity. Also, the very act of running top may break this weak
affinity and cause more processes to change CPUs more often
(because of the extra demand for cpu time).
%CPU – CPU usage The task’s share of the elapsed
CPU time since the last screen update, expressed as a percent-age of
total CPU time. In a true SMP environment, if Irix mode is Off, top
will operate in Solaris mode where a task’s cpu usage will be divided
by the total number of CPUs.
結論6: 某一個線程在其運行期間其所使用的cpu可能會發生變化。
結論7: 在多核的情況下top命令輸出的cpu使用率實質是按cpu個數*100%計算的。
三、單核情況下Cpu使用率的計算
1. 基本思想
通過讀取/proc/stat 、/proc//stat、/proc//task//stat以及/proc/cpuinfo這幾個文件獲取總的Cpu時間、進程的Cpu時間、線程的Cpu時間以及Cpu的個數的信息,然后通過一定的算法進行計算(采樣兩個足夠短的時間間隔的Cpu快照與進程快照來計算進程的Cpu使用率)。
2. 總的Cpu使用率計算方法
1、 采樣兩個足夠短的時間間隔的Cpu快照,分別記作t1,t2,其中t1、t2的結構均為:
(user、nice、system、idle、iowait、irq、softirq、stealstolen、guest)的9元組;
2、 計算總的Cpu時間片totalCpuTime
a) 把第一次的所有cpu使用情況求和,得到s1;
b) 把第二次的所有cpu使用情況求和,得到s2;
c) s2 - s1得到這個時間間隔內的所有時間片,即totalCpuTime = j2 - j1 ;
3、計算空閑時間idle
idle對應第四列的數據,用第二次的第四列 - 第一次的第四列即可
idle=第二次的第四列 - 第一次的第四列
6、計算cpu使用率
pcpu =100* (total-idle)/total
3. 某一進程Cpu使用率的計算方法
1. 采樣兩個足夠短的時間間隔的cpu快照與進程快照,
a) 每一個cpu快照均為(user、nice、system、idle、iowait、irq、softirq、stealstolen、guest)的9元組;
b) 每一個進程快照均為 (utime、stime、cutime、cstime)的4元組;
2. 分別根據結論2、結論3計算出兩個時刻的總的cpu時間與進程的cpu時間,分別記作:
totalCpuTime1、totalCpuTime2、processCpuTime1、processCpuTime2
3. 計算該進程的cpu使用率
pcpu = 100*( processCpuTime2 – processCpuTime1) / (totalCpuTime2 – totalCpuTime1) (按100%計算,如果是多核情況下還需乘以cpu的個數);
實驗: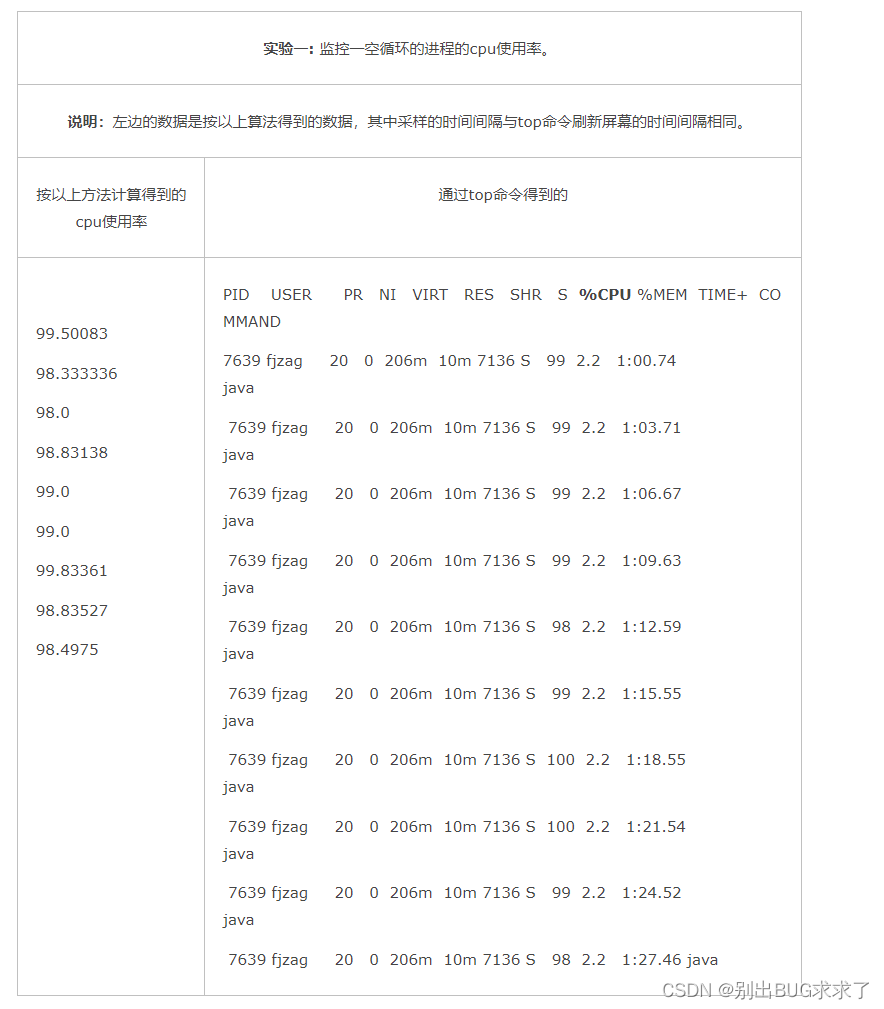
4. 某一線程Cpu使用率的計算方法
1. 采樣兩個足夠短的時間隔的cpu快照與線程快照,
a) 每一個cpu快照均為(user、nice、system、idle、iowait、irq、softirq、stealstealon、guest)的9元組;
b) 每一個線程快照均為 (utime、stime)的2元組;
2. 分別根據結論2、結論4計算出兩個時刻的總的cpu時間與線程的cpu時間,分別記作:
totalCpuTime1、totalCpuTime2、threadCpuTime1、threadCpuTime2
3. 計算該線程的cpu使用率
pcpu = 100*( threadCpuTime2 – threadCpuTime1) / (totalCpuTime2 – totalCpuTime1) (按100%計算,如果是多核情況下還需乘以cpu的個數);
實驗: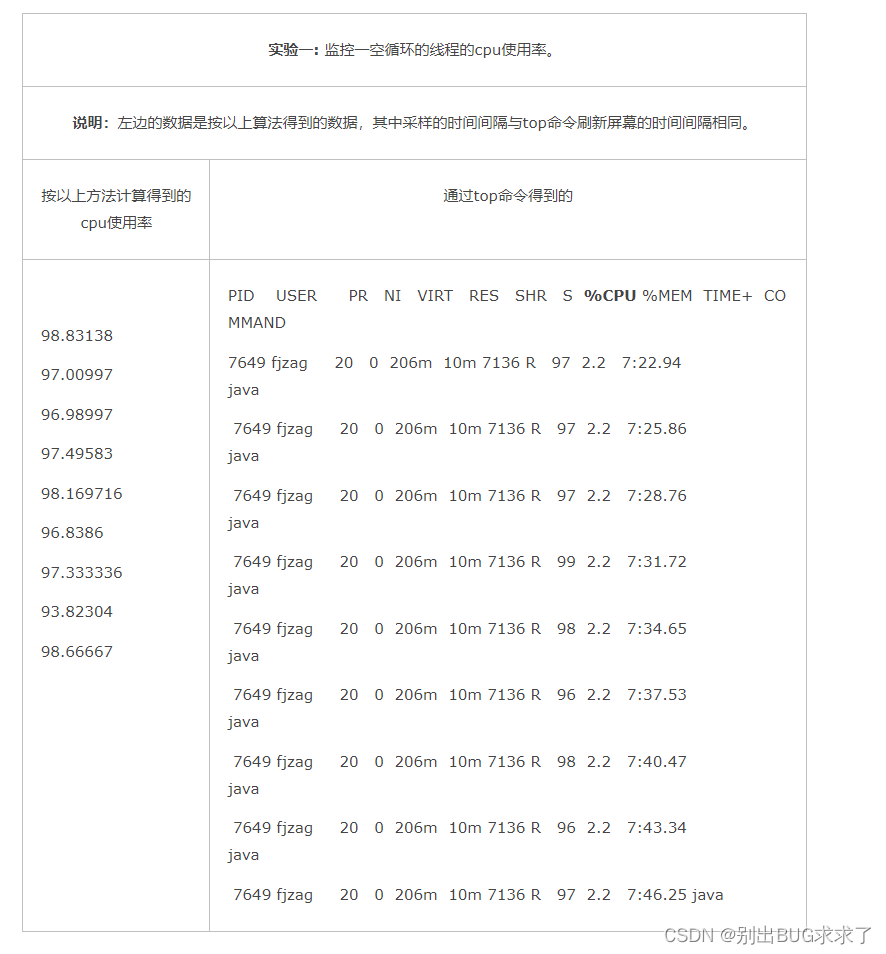
四、多核情況下cpu使用率的計算
以下通過實驗數據來說明——多核情況下某一進程cpu使用率是按cpu個數*100%計算的.
1. 實驗一
描述:
在雙核的情況下作的一組實驗,第一組數據是通過ps -eLo pid,lwp,pcpu | grep 9140命令查看進程號為9140的進程中各線程的詳細信息。第二組數據是通過 ps命令查看進程號為9140進程的cpu使用率。
數據一:
以上除了紅色標注出來的兩個線程以外,其他的線程都是后臺線程。
數據二:
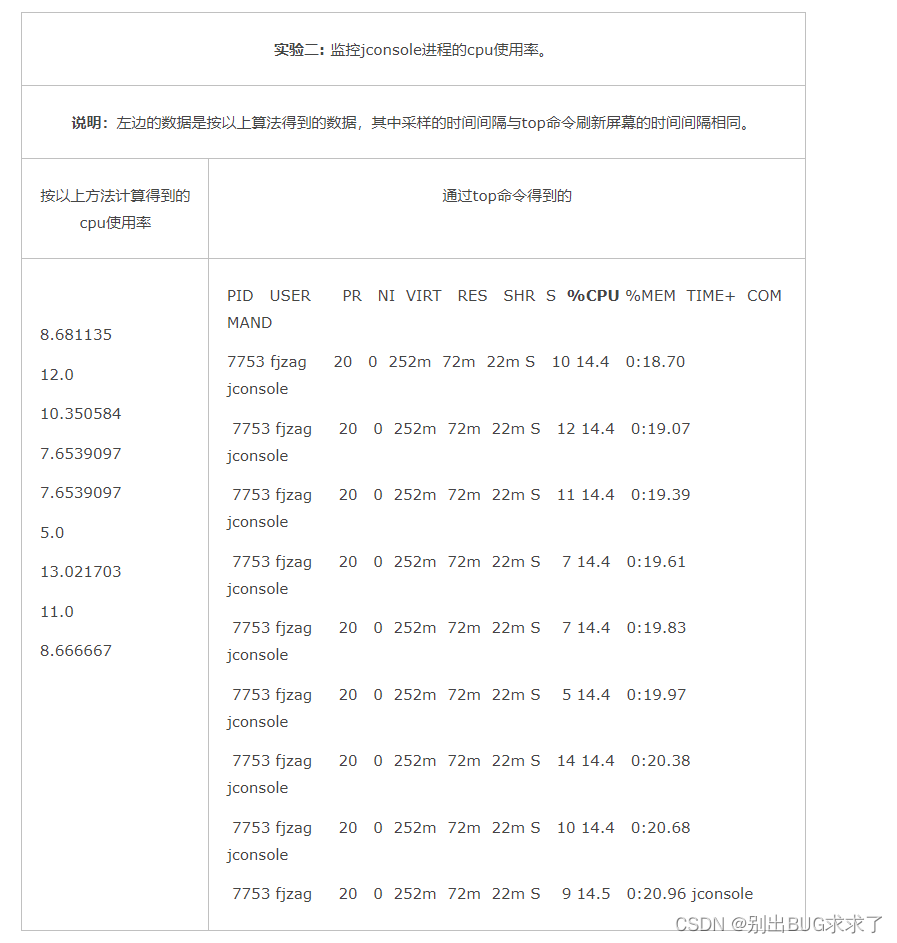
2. 實驗二
描述:
在單核的情況下作的一組實驗,第一組數據是通過ps -eLo pid,lwp,pcpu | grep 6137命令查看進程號為6137的進程中各線程的詳細信息。第二組數據是通過 ps命令查看進程號為6137進程的cpu使用率。
數據一: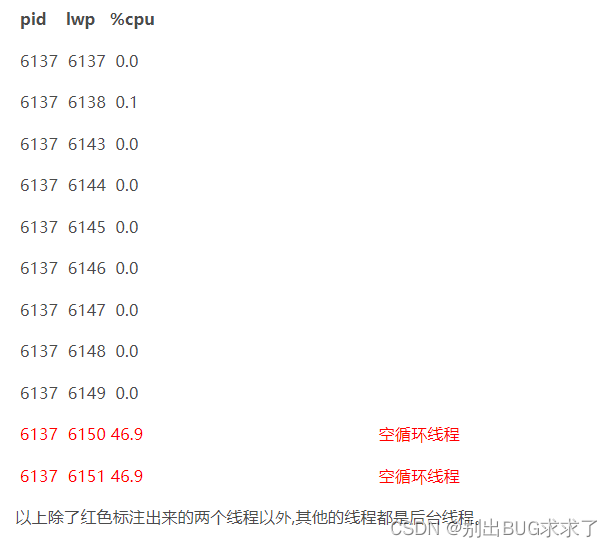
數據二:
五、主要問題:
-
不同內核版本/proc/stat文件格式不大一致。/proc/stat文件中第一行為總的cpu使用情況。
各個版本都有的4個字段: user、nice、system、idle2.5.41版本新增字段:iowait
2.6.0-test4新增字段:irq、softirq
2.6.11新增字段:stealstolen : which is the time spent in other operating systems when running in a virtualized environment
2.6.24新增字段:guest: which is the time spent running a virtual CPU for guest operating systems under the control of the Linux kernel
-
/proc/pid/task目錄是Linux 2.6.0-test6之后才有的功能。
-
關于出現cpu使用率為負的情況, 目前想到的解決方案是如果出現負值,連續采樣計算cpu使用率直到為非負。
-
有些線程生命周期較短, 可能在我們采樣期間就已經死掉了.
原文鏈接:https://blog.csdn.net/weixin_39589455/article/details/126607473
- 上一篇:沒有了
- 下一篇:沒有了
相關推薦
- 2022-11-07 python中if的基礎用法(if?else和if?not)_python
- 2024-03-22 【IDEA】Spring boot項目設置網站圖標favicon不生效
- 2022-06-10 利用Python實現RSA加密解密方法實例_python
- 2022-07-03 Python基礎教程之錯誤和異常的處理方法_python
- 2022-02-28 [rejected] master -> master (fetch first) error: f
- 2022-12-24 Python創建增量目錄的代碼實例_python
- 2022-05-17 Spring boot 集成Redis客戶端Lettuce,導致服務線程數不斷增加
- 2022-11-30 AMP?Tensor?Cores節省內存PyTorch模型詳解_python
- 欄目分類
-
- 最近更新
-
- window11 系統安裝 yarn
- 超詳細win安裝深度學習環境2025年最新版(
- Linux 中運行的top命令 怎么退出?
- MySQL 中decimal 的用法? 存儲小
- get 、set 、toString 方法的使
- @Resource和 @Autowired注解
- Java基礎操作-- 運算符,流程控制 Flo
- 1. Int 和Integer 的區別,Jav
- spring @retryable不生效的一種
- Spring Security之認證信息的處理
- Spring Security之認證過濾器
- Spring Security概述快速入門
- Spring Security之配置體系
- 【SpringBoot】SpringCache
- Spring Security之基于方法配置權
- redisson分布式鎖中waittime的設
- maven:解決release錯誤:Artif
- restTemplate使用總結
- Spring Security之安全異常處理
- MybatisPlus優雅實現加密?
- Spring ioc容器與Bean的生命周期。
- 【探索SpringCloud】服務發現-Nac
- Spring Security之基于HttpR
- Redis 底層數據結構-簡單動態字符串(SD
- arthas操作spring被代理目標對象命令
- Spring中的單例模式應用詳解
- 聊聊消息隊列,發送消息的4種方式
- bootspring第三方資源配置管理
- GIT同步修改后的遠程分支
 提供CDN加速