網(wǎng)站首頁 編程語言 正文
實現(xiàn)了在一張圖片里用matplotlib的pyplot同時繪制折線圖和柱狀圖。以以下實現(xiàn)的代碼為例子
# -*- coding:utf-8 -*-
import matplotlib
import matplotlib.pyplot as plt
import numpy as np
matplotlib.rcParams['font.sans-serif'] = ['SimHei']  # 用黑體顯示中文

# 構建數(shù)據(jù)
x = np.arange(1, 15)
y = [0.8, 0.88, 0.825, 0.76, 0.91, 0.95, 0.74, 0.99, 0.80, 0.72, 0.9, 0.81, 0.74, 0.87]
z = [37, 25, 17, 49, 27, 77, 34, 34, 34, 51, 39, 52, 47, 12]
u = [37, 31, 19, 57, 29, 86, 36, 37, 45, 64, 42, 57, 50, 24]


# 繪柱狀圖
plt.bar(x=x, height=z, label='實際', color='Coral', alpha=0.8)
plt.bar(x=x, height=u, label='總數(shù)', color='LemonChiffon', alpha=0.8)
# 在左側(cè)顯示圖例
plt.legend(loc="upper left")

# 設置標題
plt.title("Detection results")
# 為兩條坐標軸設置名稱
plt.xlabel("Component number")
plt.ylabel("Number of seam")


# 畫折線圖
ax2 = plt.twinx()
ax2.set_ylabel("recall")
# 設置坐標軸范圍
ax2.set_ylim([0.5, 1.05]);
plt.plot(x, y, "r", marker='.', c='r', ms=5, linewidth='1', label="Recall")
# 顯示數(shù)字
for a, b in zip(x, y):
    plt.text(a, b, b, ha='center', va='bottom', fontsize=8)
# 在右側(cè)顯示圖例
plt.legend(loc="upper right")
plt.savefig("recall.jpg")

plt.show()
結(jié)果: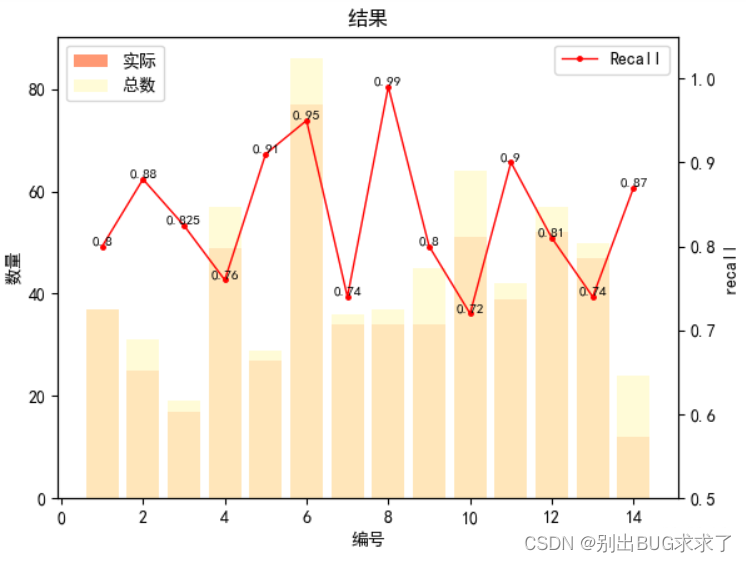
原文鏈接:https://blog.csdn.net/weixin_39589455/article/details/129160579
- 上一篇:沒有了
- 下一篇:沒有了
相關推薦
- 2022-03-29 python教程之生成器和匿名函數(shù)_python
- 2022-05-24 Django框架基礎認證模塊auth應用示例_python
- 2022-06-17 go語言beego框架分頁器操作及接口頻率限制示例_Golang
- 2022-07-07 Python使用描述符實現(xiàn)屬性類型檢查的案例解析_python
- 2022-04-28 WPF路由事件之邏輯樹和可視樹遍歷_實用技巧
- 2023-01-06 Flutter?Recovering?Stream?Errors小技巧_Android
- 2022-05-20 ASP.NET?MVC項目部署方式介紹_基礎應用
- 2022-03-07 C++中簡單的文本文件輸入/輸出示例詳解_C 語言
- 欄目分類
-
- 最近更新
-
- window11 系統(tǒng)安裝 yarn
- 超詳細win安裝深度學習環(huán)境2025年最新版(
- Linux 中運行的top命令 怎么退出?
- MySQL 中decimal 的用法? 存儲小
- get 、set 、toString 方法的使
- @Resource和 @Autowired注解
- Java基礎操作-- 運算符,流程控制 Flo
- 1. Int 和Integer 的區(qū)別,Jav
- spring @retryable不生效的一種
- Spring Security之認證信息的處理
- Spring Security之認證過濾器
- Spring Security概述快速入門
- Spring Security之配置體系
- 【SpringBoot】SpringCache
- Spring Security之基于方法配置權
- redisson分布式鎖中waittime的設
- maven:解決release錯誤:Artif
- restTemplate使用總結(jié)
- Spring Security之安全異常處理
- MybatisPlus優(yōu)雅實現(xiàn)加密?
- Spring ioc容器與Bean的生命周期。
- 【探索SpringCloud】服務發(fā)現(xiàn)-Nac
- Spring Security之基于HttpR
- Redis 底層數(shù)據(jù)結(jié)構-簡單動態(tài)字符串(SD
- arthas操作spring被代理目標對象命令
- Spring中的單例模式應用詳解
- 聊聊消息隊列,發(fā)送消息的4種方式
- bootspring第三方資源配置管理
- GIT同步修改后的遠程分支
 提供CDN加速